决策树与随机森林
信息熵与信息增益
决策树是一种树型结构,其中每个内部结点表示在一个属性上的测试,每个分支代表一个测试输出,每个叶结点代表一种类别;决策树学习以实例为基础的归纳学习算法,采用自顶向下的递归方法,基本思想是以信息熵为度量构造一棵熵值下降最快的树,到叶子节点处的熵值为零,此时每个叶子结点中的实例都是同一类。
信息增益
当熵和条件熵中的概率由数据估计(特极大似然估计)得到时,所对应的
熵和条件熵成为经验熵和经验条件熵。
信息增益表示得知特征A的信息而使得类X的不确定性减少的程度。
定义:特征A对训练集D的信息增益$g\left(D,A\right)$, 定义为集合D的经验熵$H\left(D\right)$与特征A给定条件下D的经验条件熵
$H \left( D|A \right)$
之差,即:
$$g\left(D,A\right) = H\left(D\right) - H\left(D|A\right)$$
显然,这即为训练数据集D和特征A的互信息
信息增益率
基本记号
设训练集D,
$\left| D \right|$ 表示样本个数。设K个类 $C_k$,k=1,2,…K,
$\left|C_k\right|$为属于类$C_k$
的样本个数,有: $\sum\left|C_k\right| = |D|$设特征A有n个不同的取值${a_{1},a_{2}…a_{n}}$,
根据特征A的取值将D划分为n个子集$D_{1},D_{2}…D_{n}$,$\left|D_i\right|$为$D_i$
的样本个数,$\sum\left|D_i\right| = \left|D\right|$设子集$\left|D_i\right|$
中属于类$C_k$
的样本集合为$\left|D_{ik}\right|$, $\left|D_{ik}\right|$为$D_{ik}$的样本个数
决策树
建立决策树的关键是选择哪个属性作为分类依据,根据不同的目标函数,共有三种方法来:
ID3: 使用信息增益/互信息进行特征选择。取值多的属性,更容易使数据更纯,其信息增益更大。
C4.5: 信息增益率:
CART: Gini系数
一个属性的信息增益越大,表明属性对样本的熵减少的能力越强,这个属性使得数据由不确定性变为确定性的能力越强。
损失函数
$$C\left(T\right) = \sum_{} N_{t}H\left(t\right)$$
过拟合
决策树与训练数据有很好的分类问题,但对未知的册书数据未必有好的分类能力,泛化能力弱,即可能发生过拟合现象。
剪枝
总体思路是:由完全树T0开始,剪枝部分结点得到T1,再次剪枝部分结点得到T2…直到仅剩树根的树Tk;在验证数据集上对k个树分别评价,选择损失函数最小的树Ta.三种决策树的过程相同,却别是评价标准不同:信息增益,信息增益率,基尼系数。
剪枝算法:
给定决策时T0
- 计算所有内部节点的剪枝系数
- 查找最小剪枝系数的节点,剪枝的决策树TK
- 重复以上步骤,知道决策树TK只有一个节点
- 得到T0T1T2…TK
- 使用验证眼样本集选择最优子树, 标准为平价函数(损失函数):
$$C\left(T\right) = \sum_{} N_{t}H\left(t\right)$$
Bagging与随机森林
Bagging策略
- bootstrap aggregation
- 从样本集中重采样选出n个样本
- 在所有属性上,对n个样本建立分类器
- 重复以上两步m次,获得了m个分类器
- 将数据放在这m个分类器上,最后根据这m个分类器的投票结果,决定数据属于哪一类
随机森林
- 从样本集中用bootstrap采样选出n个样本
- 从所有属性中随机选择K个属性,选择最佳分割属性作为节点建立CART决策树
- 重复以上两步m次,建立m棵CART决策树
- 这m个CART形成随机森林,通过投票表决结果
可以使用决策树,svm或逻辑回归等,总称为“随机森林”
投票机制
简单投票:一票否决;少数服从多数,有效多数(加权);阈值表决
贝叶斯投票
实践
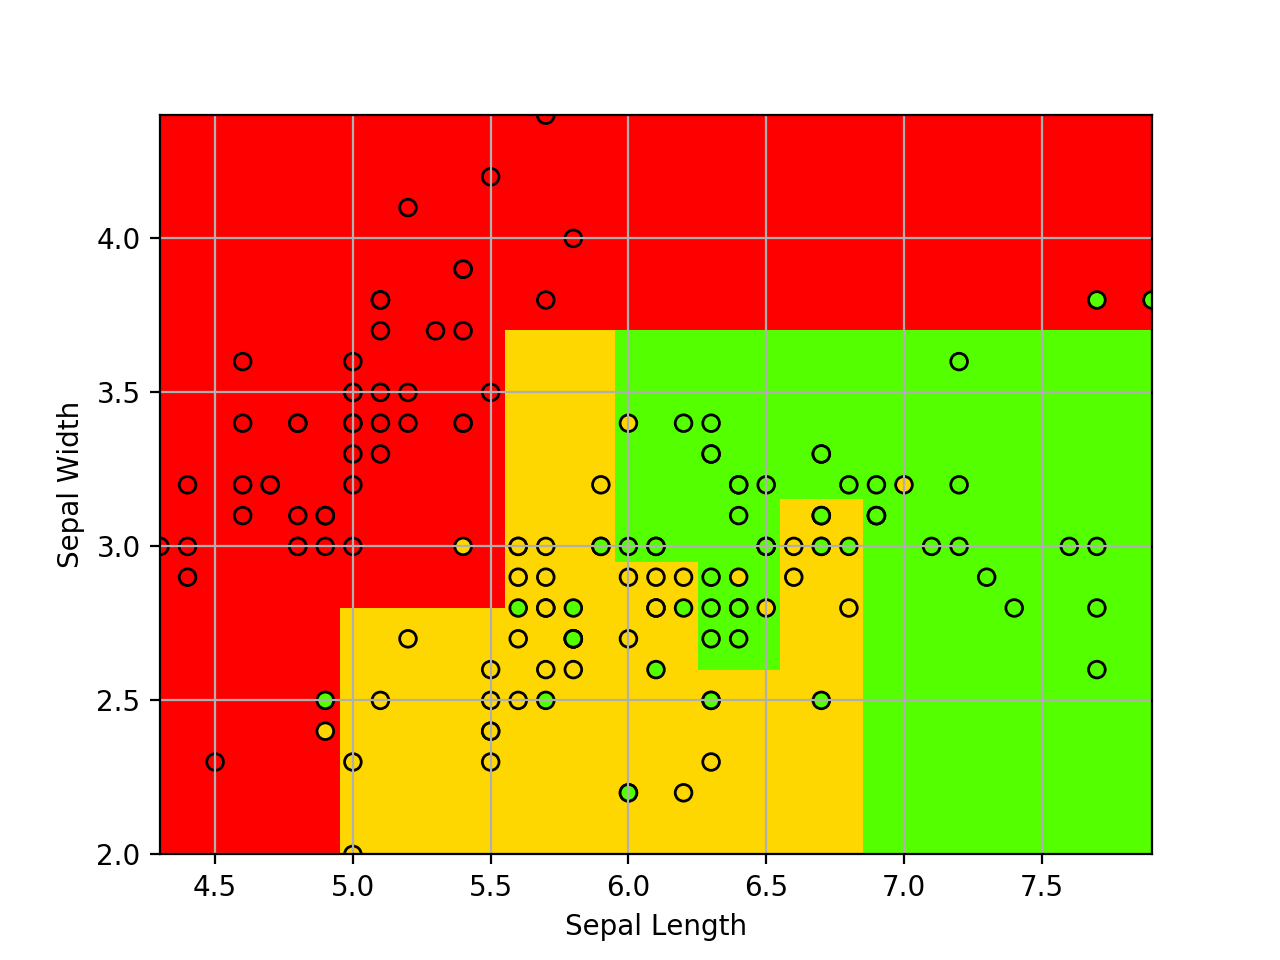
决策树
1 | from sklearn import tree |
结果:
分类准确率为:0.94
随机森林
1 | from sklearn import tree |
分类结果为:0.96
总结
- 决策树与随机森林使用简单,可以作为对数据分布探索的首要尝试算法。
- 随机森林的集成思想也可用于其他分类器的设计中。如果通过随机森林做样本异常值检测,则总计样本间位于相同决策树的叶节点的个数,形成样本相似度矩阵。